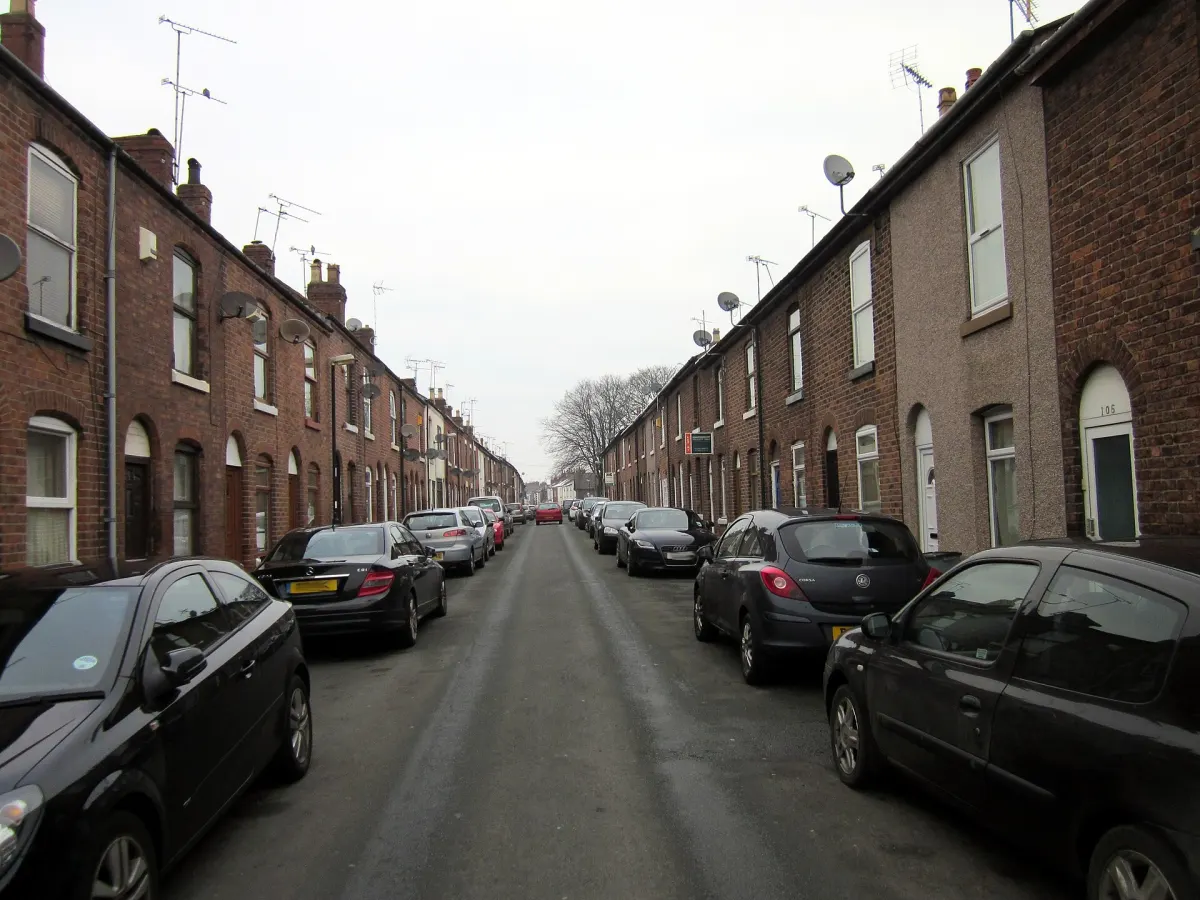

The average Chester home sold for £287,619 (Land Registry data). Prices by type, the £1.5m Curzon Park street, and why sales fell by a third in a year.
What a Chester house is “worth” depends on who you ask. An asking price is a hope; the number that matters is what buyers actually paid, which HM Land Registry records when each sale completes. This page reads those sold-price figures plainly: the city average, the borough picture, what each property type goes for, the £1.5 million street in Curzon Park, and the thing agents talk about least, a market where sales have fallen by a third in a year.
The quick answer
The average sold price for a property in Chester itself (the CH1 to CH4 postcodes) is £287,619, based on HM Land Registry data compiled by PropertySolvers for the last rolling year. That is up £6,806 (2.23%) over twelve months and £34,041 (12.27%) over five years: steady, unspectacular growth.
The official UK House Price Index puts the wider Cheshire West and Chester borough at £269,039 for June 2026, up 6.9% on the year, its highest figure since the index began in 1995. The two figures cover different ground: the index spans the whole borough from Neston to Winsford, while the PropertySolvers number is Chester sales only. The direction is the same, upwards, with the borough currently rising faster than England as a whole (1.8%).
What it means for you
If you are selling, price realistically. Chester recorded 1,095 sales in the last year, down 34.16% on the year before, homes take an average of 87 days from listing to completion, and the typical sale completes about £10,430 (3%) under asking. In June 2026 alone, 121 Chester properties cut their asking price, against 193 new listings and 171 agreed sales. A well-priced house sells; an ambitious one sits. If you are buying, the 6.9% borough rise means waiting is not free here the way it is in the stalled south, but the thin sales volume also means less competition than the last boom. If you are staying put, your home has gained roughly 2 to 6% in a year depending on where and what it is.
Prices by property type
The UK House Price Index breaks the borough down by type. These are the Cheshire West and Chester figures for June 2026 (the borough is the smallest geography the index publishes, so read them as context around the Chester figure rather than city prices):
- Detached houses: £437,424, up 6.0% on the year.
- Semi-detached houses: £267,395, up 7.8%.
- Terraced houses: £209,368, up 8.0%, the strongest riser of the four types. Hoole’s Victorian terraces are the classic Chester first move.
- Flats and maisonettes: £135,450, up 4.3%, the clear laggard.
A first-time buyer in the borough paid an average of £222,205 in June 2026, up 7.5% on the year. The borough recorded 322 sales in March 2026, the latest month with complete volume data.
Chester against its neighbours
One council, several very different markets. Here is the ladder, using the same rolling-year Land Registry sold-price basis for the towns and the June 2026 index for the borough, England and the North West:
Neston averages £316,500 (up 0.65%), the Wirral-edge premium. Ellesmere Port at £229,281, Northwich at £214,000 and Winsford at £207,916 are the borough’s value markets, all up 1 to 3% on the year. One caution on Frodsham: its recorded average of £581,810 comes from just 90 sales in the year, a sample small enough that a handful of large houses drags the number, so treat it as “expensive village” rather than a precise figure.
At the top of the Chester market itself, the most expensive street is Curzon Park North (CH4), averaging £1,477,968 across eight recorded sales, followed by Hough Green at £1,057,500 and St Georges Crescent at £956,666 (PropertySolvers).
How Chester compares more widely
Chester’s £287,619 sits a whisker under the England average of £293,262 but well above the North West average of £219,922 (both UK HPI, June 2026). The North West is rising at 4.7% a year against England’s 1.8%, the northern catch-up that has been running since 2023, and Cheshire West is riding it harder than the region: its 6.9% was the 32nd fastest of England’s 295 local authority districts in June, in a month when 62 districts fell. Affordability is the quiet good news: on the official 2024 measure the borough’s median home cost 6.2 times median earnings, against 7.54 for England and Wales (Plumplot, Land Registry data). Across ceremonial Cheshire as a whole the average is £315,000, flat on the year, with 14,100 sales, down 20.9%.
Whether Chester’s near-England prices are fair value comes down to what they buy: a walled city you can cross on foot, and a station with direct trains to London and a 41-minute run to Liverpool. What is being built next, and where, is covered in our planning news page.
Frequently asked questions
What is the average house price in Chester?
£287,619, from HM Land Registry sold-price data for the last rolling year in the CH1 to CH4 postcodes, compiled by PropertySolvers. The official UK House Price Index puts the wider Cheshire West and Chester borough at £269,039 for June 2026, an all-time high.
Are Chester house prices going up or down in 2026?
Up. Chester itself rose 2.23% over the last rolling year, and the borough index was up 6.9% in the year to June 2026, ahead of England’s 1.8%. The laggard is flats, up 4.3% across the borough against 8.0% for terraces.
How much is a detached house in the Chester area?
The borough average for a detached house was £437,424 in June 2026. In the CH4 hotspots expect far more: Curzon Park North averages £1,477,968 across its recorded sales.
What is the most expensive street in Chester?
Curzon Park North, across the Grosvenor Bridge from the city centre, averaging £1,477,968 over eight recorded sales, ahead of Hough Green (£1,057,500) and St Georges Crescent (£956,666).
How many homes actually sell in Chester?
1,095 in the last rolling year, down 34.16% on the year before, taking an average of 87 days from listing to completion and selling about 3% under asking. June 2026 saw 193 new listings, 171 agreed sales and 121 price cuts.
Where can I check what a specific house sold for?
Every completed sale in England and Wales is public. Search any street free on the HM Land Registry Price Paid service, or browse the same data on Rightmove and Zoopla.
Sources
- UK House Price Index, Cheshire West and Chester (HM Land Registry) for the borough average, property-type, first-time-buyer and sales-volume figures (June 2026; volumes March 2026).
- Chester house prices (PropertySolvers, HM Land Registry data) for the city average, annual and five-year change, transaction counts, days to sell and most expensive streets.
- PropertySolvers town pages for Neston, Ellesmere Port, Northwich, Winsford and Frodsham.
- Cheshire house prices (Plumplot, Land Registry data) for the county average, sales volume and the affordability ratio.
- HM Land Registry Price Paid search to check any individual address.
Figures are provisional and revised as more sales are registered; town, borough and county figures cover different areas and time windows, as labelled. Always confirm the latest numbers against the linked sources before making a decision.
Have your say