
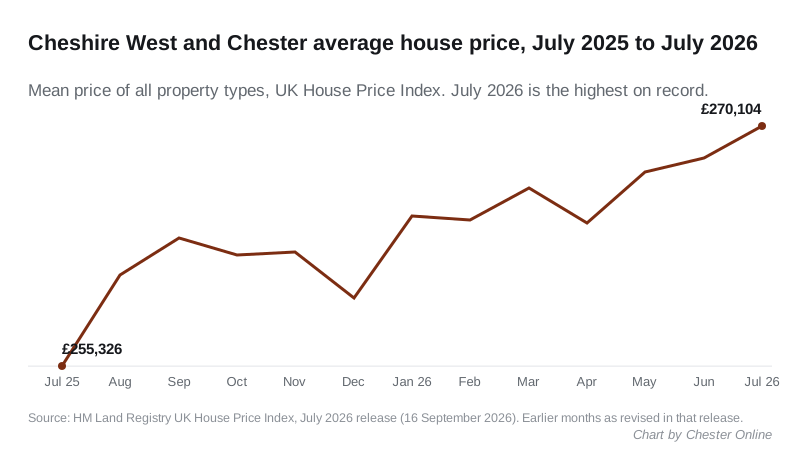
Cheshire West homes averaged £270,104 in July, a new high and up £14,778 in a year. The pace eased from 6.6% to 5.8%, still five times England's rate.
The average home in Cheshire West and Chester sold for £270,104 in July. That is the highest figure the district has recorded, beating June’s record. Prices were up £14,778, or 5.8 per cent, on July 2025.
The figures come from the Land Registry’s UK House Price Index, published on 16 September.
There is a second number in the release that matters just as much. The annual rise has slowed, from 6.6 per cent in June to 5.8 per cent in July. Prices are still climbing, just not quite as quickly.
Still near the top of the country
We ranked all 295 English local authority districts on their annual change, using the Land Registry’s July 2026 full file. Cheshire West and Chester came 25th, up from 32nd a month earlier.
England as a whole rose just 1.1 per cent, to £293,479. Eighty-five districts recorded a fall over the year. On price level rather than growth, Cheshire West sits 176th of 295, still £23,375 below the England average.
The neighbours
| Area | July 2026 average | Change over 12 months |
|---|---|---|
| Cheshire East | £309,121 | +5.0% |
| Cheshire West and Chester | £270,104 | +5.8% |
| Warrington | £260,040 | +5.4% |
| Wirral | £221,849 | +6.7% |
| Flintshire | £215,892 | +2.3% |
| Wrexham | £212,778 | +2.2% |
| Halton | £194,727 | +1.8% |
| North West | £221,445 | +4.4% |
| England | £293,479 | +1.1% |
Wirral was the only neighbour rising faster. Over the border, Flintshire managed 2.3 per cent.
That leaves a home in Flintshire £54,212 cheaper than one in Cheshire West on average. In July 2025 the gap was £44,294. It has widened by £9,918 in a year, which matters to anyone weighing a move across the Dee.
What rose, by type
Every property type rose, but not at the same speed:
- Semi-detached: £268,376, up 6.6 per cent, or £16,625
- Terraced: £210,684, up 6.5 per cent, or £12,864
- Detached: £439,189, up 5.5 per cent, or £22,805
- Flats: £135,419, up 2.2 per cent, or £2,958
A first-time buyer paid an average of £223,143, up 6.2 per cent, or £12,969. Buyers who already owned a home paid £323,124.
Semis and terraces are still rising faster than detached houses in percentage terms, though detached homes added the most in pounds. Flats have barely moved.
June has already been revised down
UKHPI is a mean average, not a median. A few expensive sales pull it up, so it is not what a typical house costs. It is best read as a direction of travel.
Every month is revised as late sales are registered. When we reported June’s record last month, the index put it at £269,039 and 6.9 per cent. The July release revises June to £268,132 and 6.6 per cent, £907 lower. July’s £270,104 will probably move too when August is published.
Anyone comparing with our June story will see a bigger drop, from 6.9 to 5.8 per cent. Part of that is June being marked down, not July cooling.
What it means for you
If you are selling, the district is at a record, but that is an average from Neston to Winsford. It is not a price for your street. Sold prices by postcode are free to search on the Land Registry’s site.
If you are buying a first home, the average first-time buyer price rose by nearly £13,000 in a year. The slowdown is small, and it is too early to call it a turn.
If you are staying put, rising prices do not change your council tax. Bands still rest on 1991 values; our Chester council tax bands page has this year’s charges.
For town-by-town prices and asking-price trends, see our Chester house prices page.
Sources
- UK House Price Index, Cheshire West and Chester, July 2026, HM Land Registry
- UK HPI full file, July 2026 (CSV), HM Land Registry, used for the national ranking, the neighbouring areas, the property-type figures and the June revision
- UK House Price Index for July 2026, GOV.UK, the release notice dated 16 September 2026
Have your say