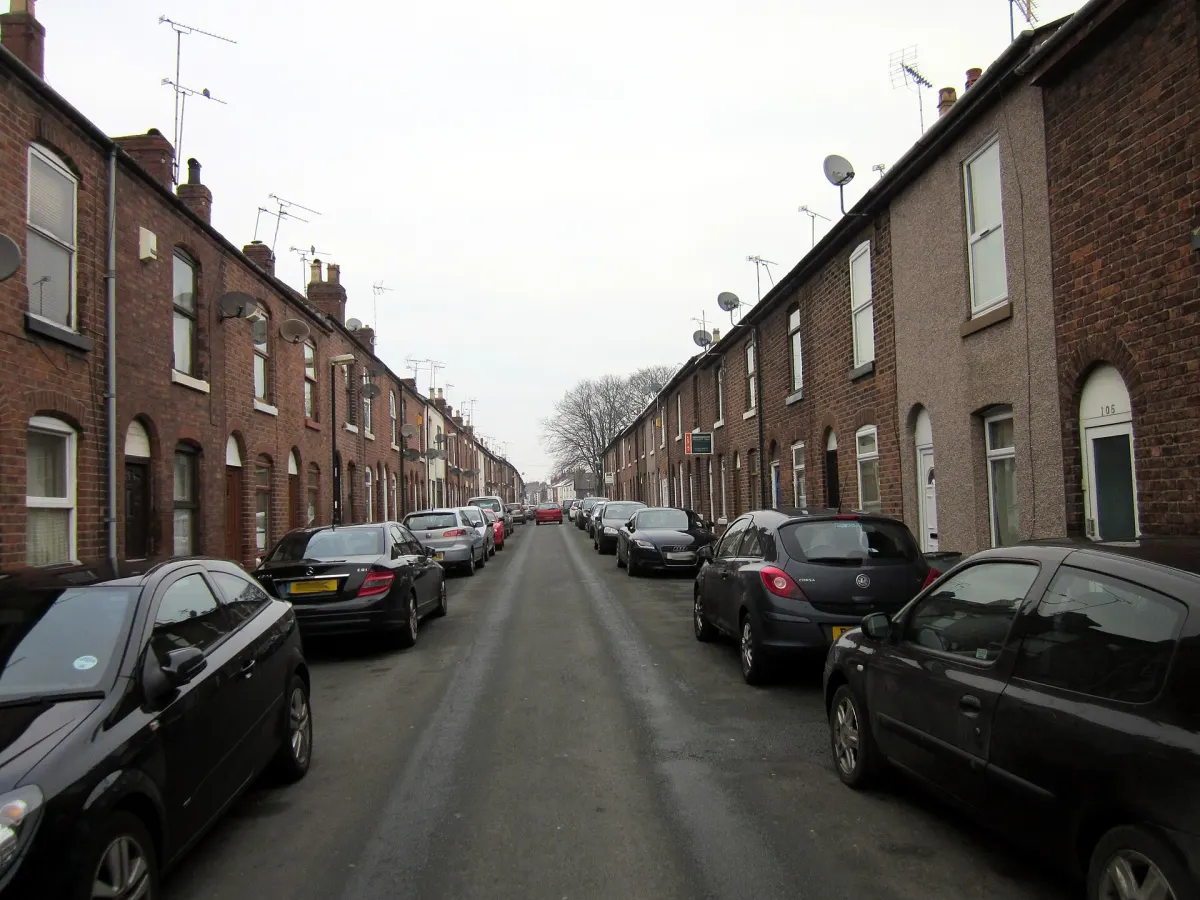

Homes in Cheshire West and Chester averaged £271,627 in September, a new high. The annual rise has halved since June, from 6.6% to 3.3%, and flats have not moved in a year.
The average home in Cheshire West and Chester sold for £271,627 in September. That is the highest figure the district has recorded. It is up £8,557, or 3.3 per cent, on September 2025.
The figures come from the Land Registry’s UK House Price Index, published on 18 November.
Prices are still rising, but more slowly. The annual rise was 6.6 per cent in June. It has fallen every month since, to 5.2 per cent in July, 3.9 per cent in August and 3.3 per cent now. The monthly rise from August to September was just 0.2 per cent.
Still well ahead of England
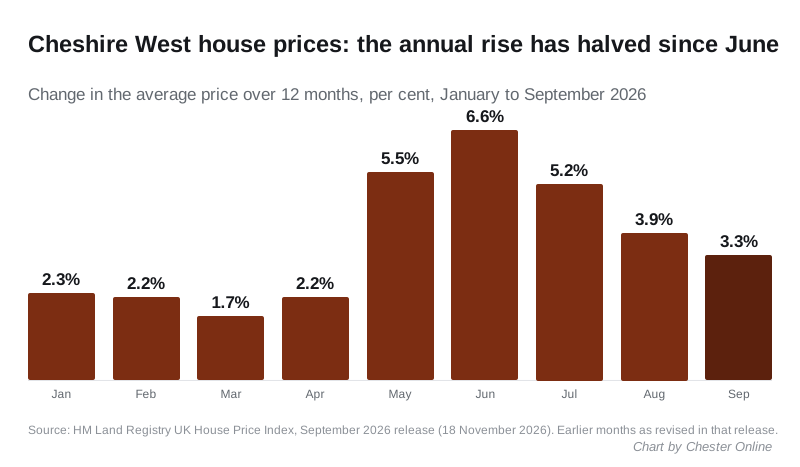
We ranked all 295 English local authority districts on their annual change, using the Land Registry’s September 2026 full file. Cheshire West and Chester came 55th.
England as a whole rose 0.8 per cent, to £292,998. 108 districts recorded a fall over the year. On price level rather than growth, Cheshire West sits 176th of 295, £21,371 below the England average.
The neighbours
| Area | September 2026 average | Change over 12 months |
|---|---|---|
| Cheshire East | £311,652 | +4.0% |
| Cheshire West and Chester | £271,627 | +3.3% |
| Warrington | £257,671 | +1.9% |
| Wirral | £221,869 | +3.7% |
| Flintshire | £217,955 | +4.1% |
| Wrexham | £213,491 | +1.3% |
| Halton | £193,004 | +1.2% |
| North West | £220,477 | +3.2% |
| England | £292,998 | +0.8% |
In the July figures we reported in September, Cheshire West was rising faster than every neighbour except Wirral. Now Flintshire, Cheshire East and Wirral are all ahead of it.
Over the border, a home in Flintshire is £53,672 cheaper on average. A year ago the gap was £53,741, so it has barely moved.
What rose, by type
- Detached: £442,106, up 3.2 per cent, or £13,652
- Semi-detached: £269,932, up 4.0 per cent, or £10,324
- Terraced: £211,769, up 3.7 per cent, or £7,481
- Flats: £135,876, up £1 on a year ago, so no change at all
A first-time buyer paid an average of £224,444, up 3.6 per cent, or £7,879. Buyers who already owned a home paid £324,991, up 3.1 per cent.
The summer figures have moved
UKHPI is a mean average, not a median. A few expensive sales pull it up, so it is not what a typical house costs. It is best read as a direction of travel.
Every month is revised as late sales are registered. August was first published at £270,534 and 3.7 per cent. It now stands at £271,087 and 3.9 per cent.
July has moved the other way. When we reported July’s record in September, the index put it at £270,104 and 5.8 per cent. It now stands at £268,667 and 5.2 per cent, £1,437 lower. September’s figure will probably move too when October is published in December.
What it means for you
If you are selling, the district average is at a record, but it covers everywhere from Neston to Winsford. It is not a price for your street. Sold prices by postcode are free to search on the Land Registry’s site.
If you are buying a first home, the first-time buyer average rose by about £7,900 in a year, against nearly £13,000 in the year to July. The rise is slowing, not reversing.
If you own a flat, the average flat in the district is worth what it was a year ago, while houses of every type have gone up.
Sources
- UK House Price Index, Cheshire West and Chester, September 2026, HM Land Registry
- UK HPI full file, September 2026 (CSV), HM Land Registry, used for the national ranking, the neighbouring areas, the property-type figures and the revisions
- UK HPI full file, August 2026 (CSV), HM Land Registry, for August as first published
- UK House Price Index for September 2026, GOV.UK, the release notice dated 18 November 2026
Have your say